
Health inequalities across north west London
This map highlights variation in preventable mortality and related health outcomes across North West London boroughs.
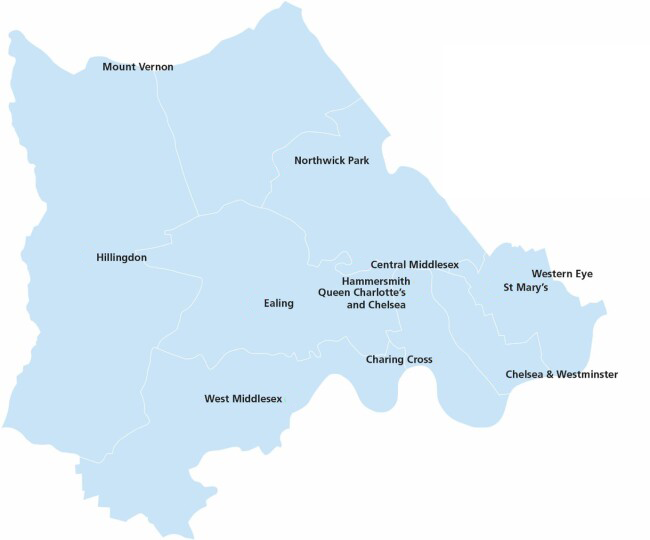
Explore health variation across North West London
Select a red dot on the map to explore preventable mortality and health inequality in the surrounding area.
Hillingdon
Preventable mortality: close to the North West London average.
Main driver: circulatory disease.
Insight: variation linked to deprivation and age profile.
Harrow and Brent
Preventable mortality: among the highest in North West London.
Highest risk: circulatory and hypertensive heart disease.
Inequality: Brent has the lowest mean deprivation decile.
Ealing
COVID-19: top five nationally for mortality.
Respiratory disease: highest rate in North West London.
Pattern: strong link to deprivation.
Hounslow
Preventable mortality: higher than national average.
Key drivers: circulatory disease, housing, and employment.
Challenge: persistent inequality.
Central London
Pattern: sharp contrasts between communities.
Life expectancy: highest and lowest sit side-by-side.
Insight: deprivation, housing, and population churn matter.
What the data shows
These headline figures illustrate the scale of health inequality across North West London, using the most recent available data to highlight differences in outcomes between communities.